
How to Design a Machine Learning Trading Bot - Part 3: Pattern Recognition
Bahman
Published on Dec 29, 2020
Previously on “How to design a machine learning trading bot”
We have started with “Collecting Data”.
We found out what OHLCV data is, and we learned why we need historical data and online data together.
Then we continued with “Data Analysis”.
We saw how important data cleaning—including feature engineering—is. To make a stable machine learning model, we must prepare data the right way and, finally, visualize it to reach the goal.
So, let’s start the third step considering that we already have valid data in our hands.
This article is the third episode in the series titled “How to design a machine learning trading bot”.
Step 3: Finding a pattern in analyzed data
Discovering patterns in the data is a fundamental task that blends advanced machine-learning methods with your creativity.
Let’s start with this main question in the market:
Do you believe some patterns in the market repeat frequently? If so, we are on the same track.
Let’s start with one of the simplest patterns in technical analysis: the Trend. If you don’t know what a trend is, pause here for a minute and search on Google.
We can find two main patterns in trends: Bullish (Up Trend) and Bearish (Down Trend). (Again, if you don’t know about them, pause and search on Google.)
Let’s recap what we’ve done so far. We broke the problem of “finding a trend (pattern)” into a smaller problem: detecting bullish/bearish trends. The key is: we don’t start searching for patterns blindly in raw numeric data.

In the pattern-recognition phase, be careful. Pattern hunting can turn into “Astrology” or “Horoscope” if you chase nonsense. There’s a lot of data, and you can always weave stories between patterns. On the other side is “Astronomy”. Always follow the data like an astronomer and a scientist—not an astrologer or a horoscopist.

Back to our sample: we want to find the Bullish Trend pattern. One of the simplest strategies is using the Moving Average.
Bullish and Bearish pattern
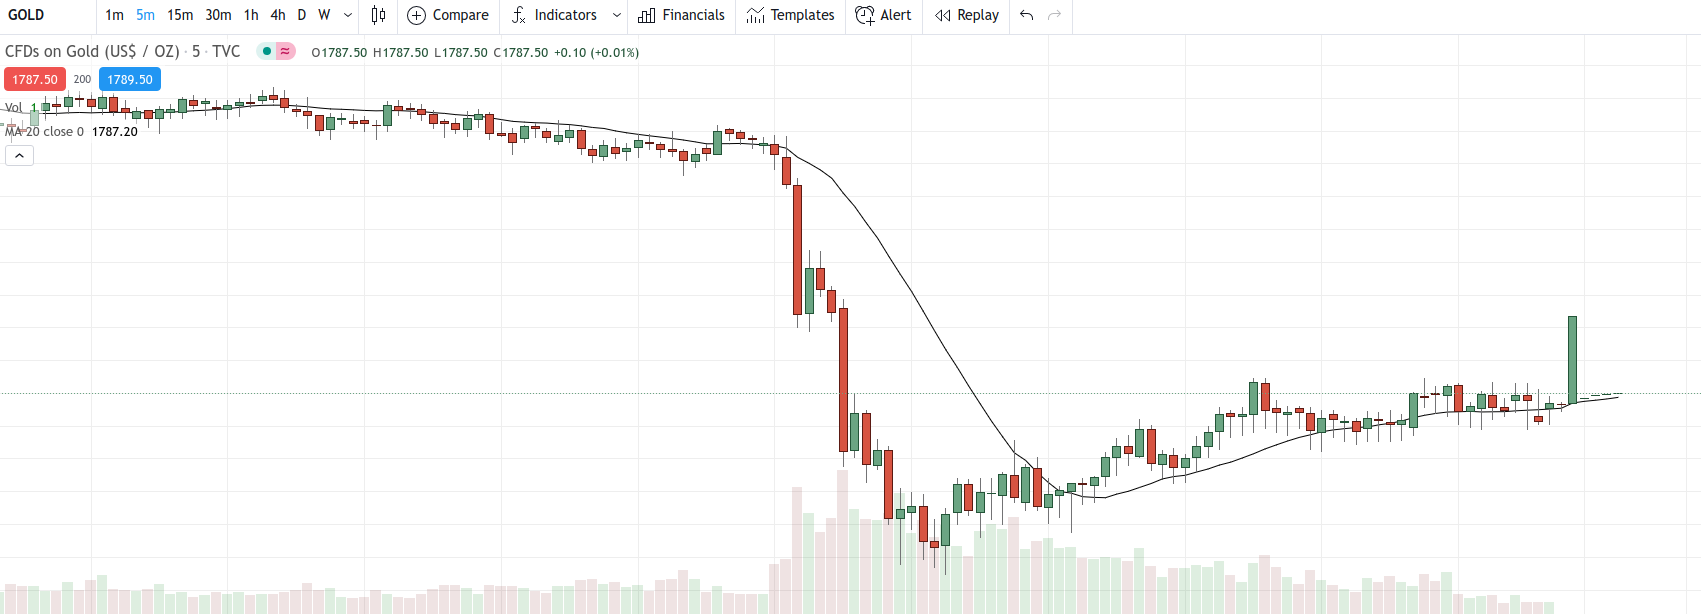
Finding a bullish trend by comparing price to SMA20 (Simple Moving Average 20) is simple and effective—my “Hello, World!” of trading courses ;)
In the chart below, follow SMA20 as the black curved line. We can define:
- Bullish: if Close > SMA20
- Bearish: if Close < SMA20
Machine Learning
When does machine learning show up? To solve a problem with ML, you choose a method. Some problems fit Unsupervised Learning; others fit Regression. As always, we start simple—with Binary Classification.
In binary classification, each record has a label [0,1], and the model predicts 0 or 1 for new records.
How can this help detect a bullish trend? We’ll implement it next season (“How to develop a machine learning trading bot”). For a conclusion here, assume:
For each record, set the label to 1 if Close > SMA20; otherwise set it to 0. In the end, we have an OHLCV dataset (see the first episode on Data Collection) including SMA20 and a target column [0,1]. After training an ML classifier, if the prediction is 1 we’re in a bullish trend; if it’s 0, we’re not.
I always start with a simple concept. Once you fully understand the idea, you can develop it into a more complex solution.