Unlocking the Power of ML Visualization with Comet: How We Optimize and Understand Our Models at 1DES
Maryam
Published on Jun 17, 2024
At 1DES, we rely on Comet as a powerful platform for tracking, visualizing, and understanding our machine learning experiments. With its user-friendly interface and collaborative tools, Comet has become an essential part of our workflow for building, refining, and explaining ML models.
Visualizing Model Predictions and Architecture
Comet helps us track and visualize model predictions with clarity. By exploring the model architecture visually, we can spot potential design issues, validate assumptions, and fine-tune the structure for better results. These visual diagnostics accelerate our experimentation cycle and help ensure each model iteration is grounded in evidence.
Understanding Performance with Confusion Matrices and Reports
For classification tasks, Comet enables us to generate confusion matrices—a simple yet powerful way to compare predicted versus actual outcomes. These matrices, paired with detailed classification reports, help us assess the performance of each class and guide our next steps for model tuning.
Exploring High-Dimensional Data with t-SNE and UMAP
High-dimensional data can be difficult to interpret. Comet supports advanced embedding techniques such as t-SNE and UMAP to reduce dimensionality while preserving structure. These visualizations allow us to:
- Explore data point relationships
- Identify natural clusters
- Reveal underlying patterns
Their interactive nature deepens our understanding of the data landscape and uncovers insights that aren’t always visible through raw metrics.
Key Benefits at 1DES
✅ Improved Model Understanding
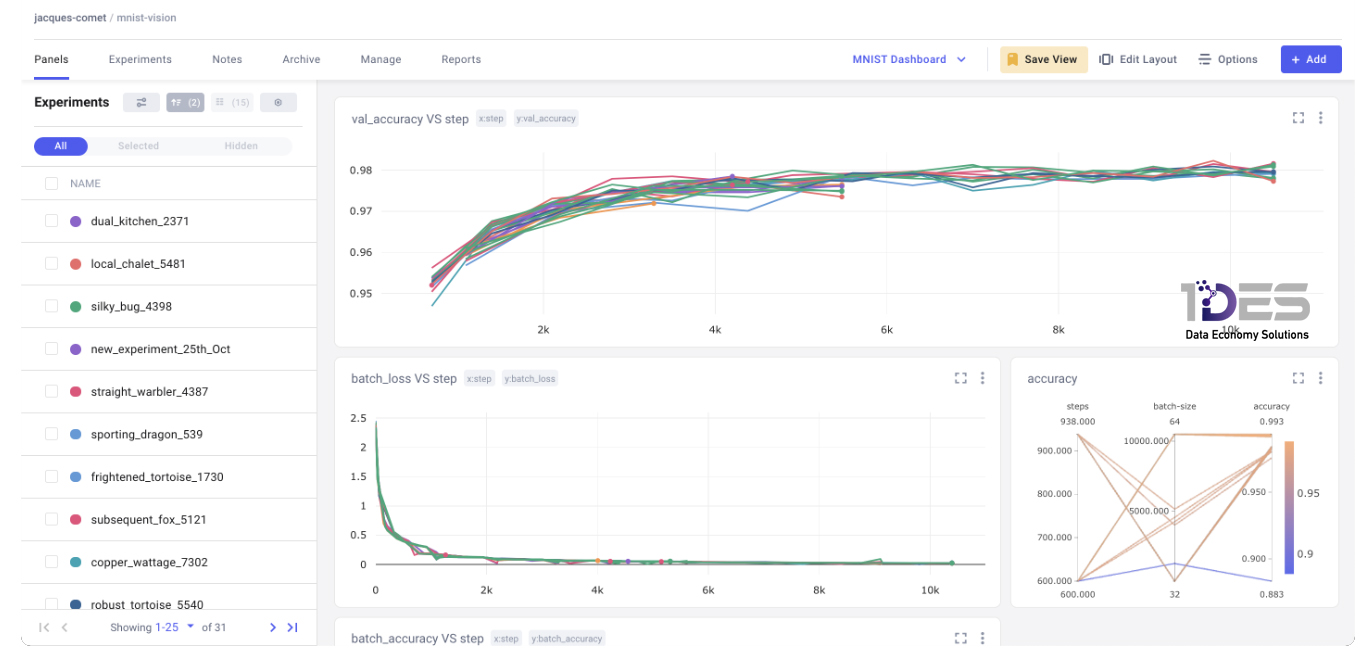
Visualizing metrics, predictions, embeddings, and architectures helps us pinpoint strengths, weaknesses, and areas needing improvement.
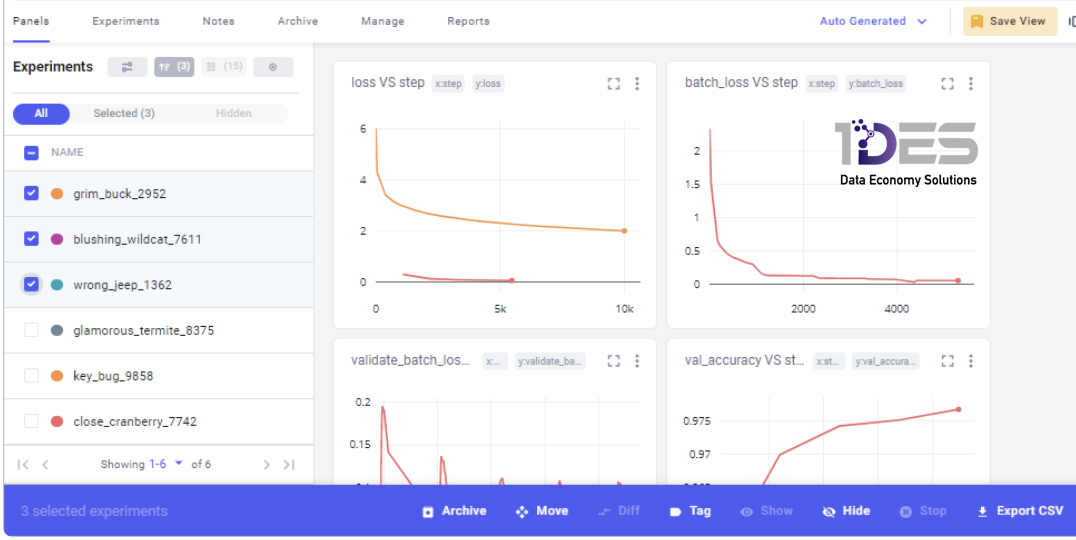
✅ Experiment Comparison Made Easy
We can compare different experiments side-by-side and identify the most promising models and hyperparameter settings with clarity.
✅ Stronger Collaboration and Communication
Comet’s visual dashboards are easy to share across teams and stakeholders, enabling meaningful discussions and better decision-making.
✅ Faster Debugging and Optimization
By having a real-time visual of how our models perform, we can quickly identify bottlenecks, adjust architectures, and optimize performance.
Final Thoughts
Data visualization isn’t just a nice-to-have—it’s essential for modern machine learning. Comet equips us with the tools to see what our models are doing, communicate those insights, and iterate with confidence. From early exploration to final deployment, Comet helps us unlock the full potential of our ML workflows.