
How to Enhance Algo Trading Win Rate with ML - Part 1: Labelling Data
Mehdi
Published on Jan 29, 2022
In an era of trading automation, algorithmic trading has become a popular method for gaining profit for a variety of people and companies. The advantage is that you can run an algorithm-based bot to execute trades for you and earn profits across multiple markets. Nevertheless, many algorithms may have low win rates due to the different circumstances that unfold on the market, which makes your algorithm inefficient and useless. That's when machine learning may be useful to solve this problem and maximize potential profit.
How to Enhance Algo Trading Win Rate with ML: Labelling Data
In this series of articles, we will examine if machine learning can improve an algorithmic strategy's win rate on the Binance BTC/USDT market.
This will be accomplished using 1H historical OHLC data.
First, we calculate the win rate of an algorithmic strategy using the Python backtesting library. Next, we use a machine learning model on the same data and timeline to improve our win rate.
In this experiment we will focus on these 3 areas:
Part 1: Labelling Data
Part 2: Feature Selection
Part 3: Comparing backtest results and training
Part 1: Labelling Data
When it comes to the cryptocurrency market, there may be many algorithmic strategies to consider. We will use the simple and popular strategy known as "Moving Average Crossover" to simplify the problem. When the shorter-term SMA crosses above the longer-term SMA, it's a buy signal, since it indicates that the trend is shifting upward. Meanwhile, when the shorter-term SMA crosses below the longer-term SMA, it's a sell signal, as it indicates that the trend is changing downward. The SMA9 and SMA20 of the close price of the Binance BTC/USDT 1-hour timeframe are used in this example.
Our experiment will be implemented in the Jupyterlab environment. Clone the improve_algorithmic_trading_ml repository and run the 1-labeling_data.ipynb for a better understanding.
Block [1-3] – First, let's explore the data. In addition to the Binance 1-hour OHLCV data from 2017-08-17 to 2021-11-10, we have added several indicators.

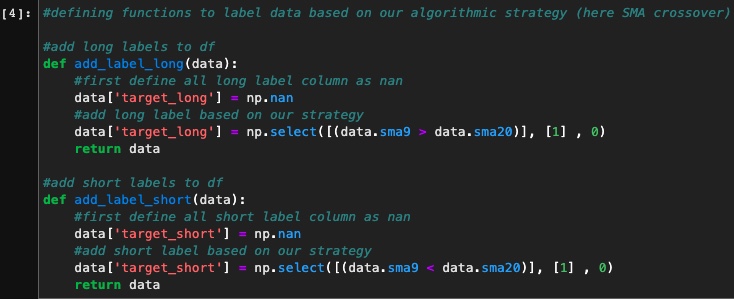
Block [4-8] – Now let's label our data based on our SMA crossover strategy. When SMA9 > SMA20 it’s a buy signal so we label our data as "target_long" and when SMA9 < SMA20 it’s a sell signal so we label our data as "target_short."
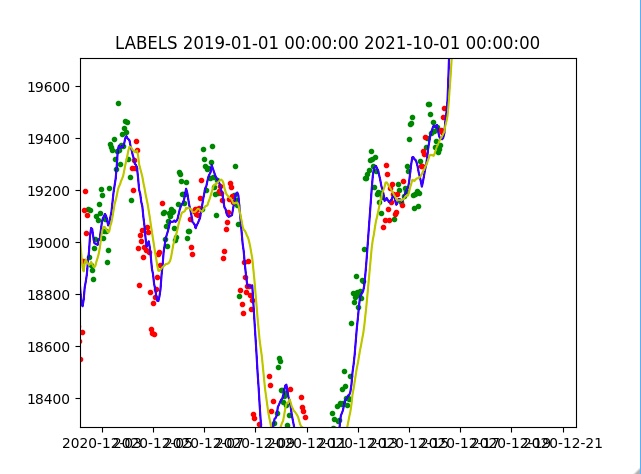
Then we visualize using pyplot. Long labels are green points, short labels are red, SMA9 and SMA20 are blue and yellow lines respectively. Below is a sample:
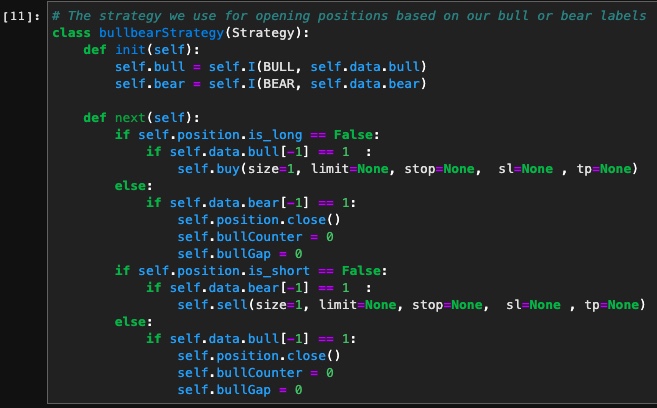
Block [9-13] – The Backtesting library provides a Strategy class to open/close positions. We map "bull"/"bear" flags to target_long/target_short so our backtest code stays the same even if labeling changes.
Running a backtest gives a win rate:
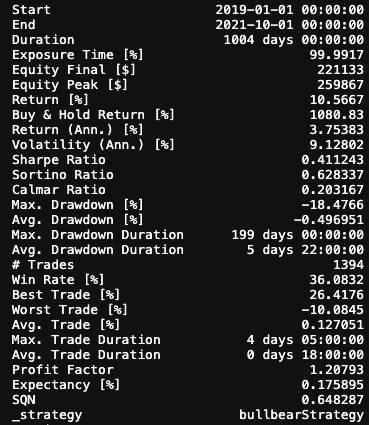
Based on 1394 trades, we had a win rate of 36.08%, which is not as high as you might expect. To improve, we need correct labels. Errors in labels feed wrong data to our model.
Block [14-19] – To fix labels, we simulate trades and remove those that lost, iterating through labels and correcting mislabels.
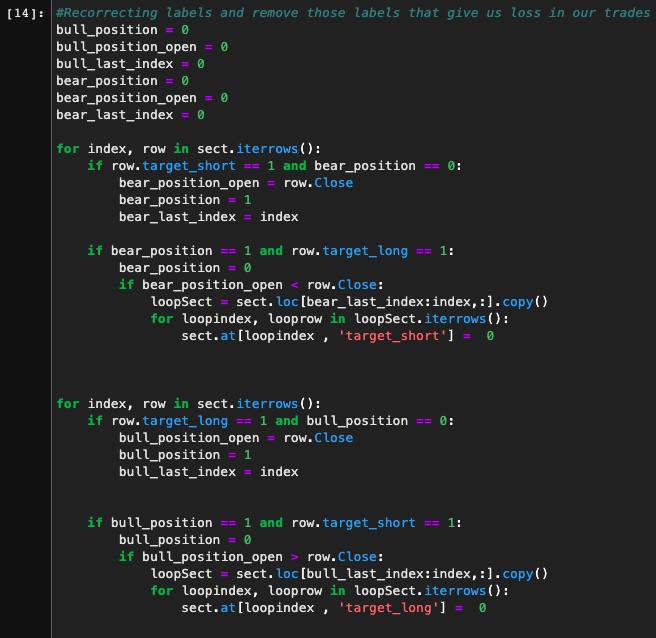
After correction, running backtests again yields a 100% win rate. We now have a clean dataset to feed into our ML model.
In the next article, we’ll explore feature selection, train our model, and see if we can improve the win rate further.